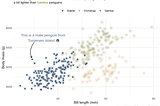
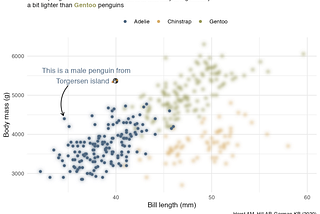
Giulia RuggeriBetter data communication with {ggplot2}, part 2Styling a chart using {ggfx} , {ggforce} and annotate()5 min read·Jun 1, 2021--2--2
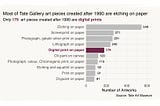
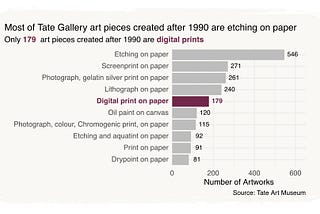
Giulia RuggeriBetter data communication with {ggplot2}Styling a chart using {forcats} and {ggtext} and {scales}8 min read·Jan 29, 2021--2--2
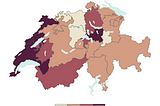
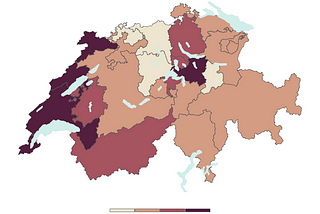
Giulia RuggeriinEPFL Extension SchoolMaking a map of COVID-19 incidence in Switzerland using ggplot2 and sfApplying the grammar of graphics to map creation6 min read·Oct 27, 2020--2--2
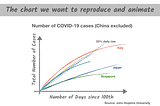
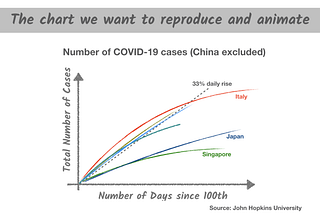
Giulia RuggeriinEPFL Extension SchoolFrom static to animated time series: the tidyverse wayReproducing and animating COVID-19 time series using R7 min read·Apr 17, 2020--1--1